Research | July 2020 Hearing Review
The complexity surrounding definitions of hearing loss and accessibility
By Larry Humes, PhD
Repeatedly, research and large-scale studies have identified self-reported hearing difficulties as one of the strongest predictors of hearing aid uptake and use. This further reinforces the need for the older consumer and the hearing care professional to quantify the severity of hearing difficulties above and beyond those captured by the pure-tone audiogram
Throughout much of the history of audiology there have been a wide range of attempts to define “normal” hearing (eg, see the historical review by Kryter1). For a variety of reasons, including simplicity and reliability of measurement as well as association with speech communication, these definitions were based on air-conduction pure-tone audiometry. There have been many scholarly debates about exactly which frequencies should be averaged to capture the severity of hearing impairment, as well as the value of that average which defines the lower “fence” or boundary between “normal” and impaired hearing (eg, Kryter2,3 and Clark4). The focus was often the medico-legal applications of this information as in compensation for injury, including occupational hearing loss. In addition to the boundary between “normal” and impaired hearing, these pure-tone averages are often used to categorize the magnitude of the hearing impairment in a few descriptive terms, such as “mild, “moderate,” or “severe,” among others.4
Further reading: Audiologic Considerations for People with Normal Hearing Sensitivity Yet Hearing Difficulty and/or Speech-in-Noise Problems
Definitions of “Normal Hearing” Using Pure Tones
The decline of hearing sensitivity for pure tones with advancing age in adults has been studied frequently over the past several decades. The results of many of those studies for “otologically normal” samples have been synthesized most recently by the International Standards Organization (ISO) in ISO-7029.5 Figure 1 shows the median audiograms from ISO 7029 for males (top) and females (bottom) at ages 30, 40, 50, 60, 70, and 80 years. These data represent the best estimates of pure-tone hearing loss in aging adults for the average men and women of those ages.
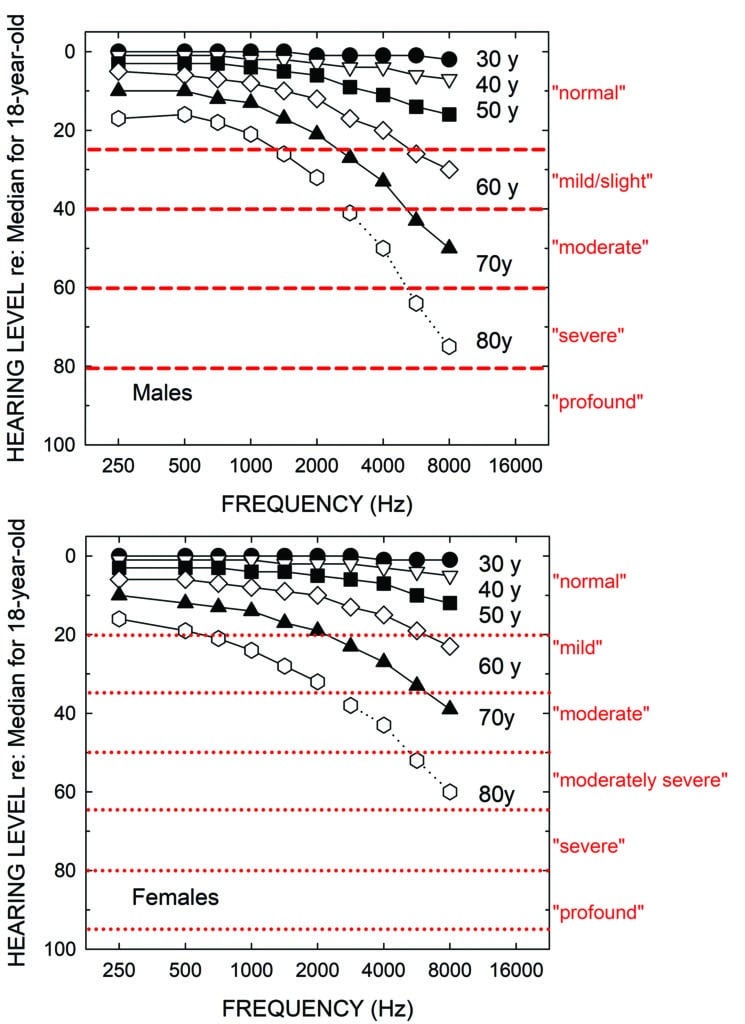
As noted, a variety of schemes have been proposed over the years to not only define the lower fence between “normal” and impaired hearing, but also to assign labels or boundaries for other degrees of hearing loss severity.4 The red horizontal lines and red labels to the right of the top panel in Figure 1 depict the original severity boundaries recommended by WHO,6 a guideline operational until just recently. The new boundaries and labels adopted by WHO7 are shown in the bottom panel of Figure 1. An evaluation of both systems has been published recently by the author.8,9 In both WHO hearing-impairment grading systems, the severity is quantified by the pure-tone average at 500, 1000, 2000, and 4000 Hz in the better ear. Although the boundaries are derived just for frequencies of 500 through 4000 Hz, the horizontal lines are extended across the entire range of frequencies in Figure 1. This is because these same labels are often used clinically to describe the start and end points of sloping or rising audiograms. For example, the audiogram of the average 80-year-old male in the top panel of Figure 1 might commonly be referred as a “mild-to-severe sloping high-frequency hearing loss” rather than by its WHO-based grade of “mild”.
If one calculates the WHO hearing-impairment grade using the four-frequency pure-tone average (PTA4), assuming the audiograms shown represent the better ear, those for men and women 30, 40, 50, 60, and 70 years of age would all be labeled “normal”! That is, only the average 80-year-old man and woman would be considered to have a “mild” or “slight” hearing loss using either of these WHO-based definitions.
It should be emphasized that this problem is not unique to the WHO hearing-impairment grading system, as many others yield similar classifications for age-related hearing loss (or other sloping audiometric configurations, such as occupational hearing loss).4 The fundamental problem for age-related hearing loss, as shown in Figure 1, is that hearing is often well within the “normal” range at the lower two frequencies (500 and 1000 Hz) included in most pure-tone averages, as is the case for the average used by WHO. Clearly, considering just the audiograms in Figure 1, most clinicians would consider the audiograms for the average 50-, 60- and 70-year-old male and female as evidence of measurable hearing loss in the high frequencies—certainly enough hearing loss to have potential impact on everyday function and enough to be considered for intervention. Again, all these audiograms are designated as normal by WHO based on the better-ear PTA4.
Further evidence that many older adults labeled as having “normal” hearing do not truly have normal hearing function can be found in Figure 2. The top panel of Figure 2 shows a scatterplot of scores on the Hearing Handicap Inventory for the Elderly-Screening version (HHIE-S)10,11 versus the better-ear four-frequency pure-tone average. The HHIE-S is a self-report measure of perceived hearing difficulties in social situations and the respondent’s emotional reaction to those difficulties. Higher scores reflect greater perceived hearing problems. The data have been combined from a large population dataset from the Blue Mountains Eye Study (BMES) in Australia12 and a large clinical dataset from the Veterans Administration in Tennessee.13 The total sample size, restricted to adults 50 years of age and older, is 5,557. Using the WHO definition of unilateral hearing loss,7 the small number of such cases in each dataset were removed as age-related hearing loss is considered to be bilaterally symmetrical. The symbols in the scatterplot in the top panel are color-coded according to the original WHO6 hearing-impairment classification system. Clearly, there are large individual differences in the perceived hearing problems of older adults within each hearing-loss severity group—including those labeled “normal”. As noted in the lower right corner of the top panel, however, there is a moderate correlation (r=0.61) between better-ear PTA4 and the perceived difficulties as measured by the HHIE-S. When age is controlled via a partial correlation, the partial r (rp) increases slightly to 0.69.
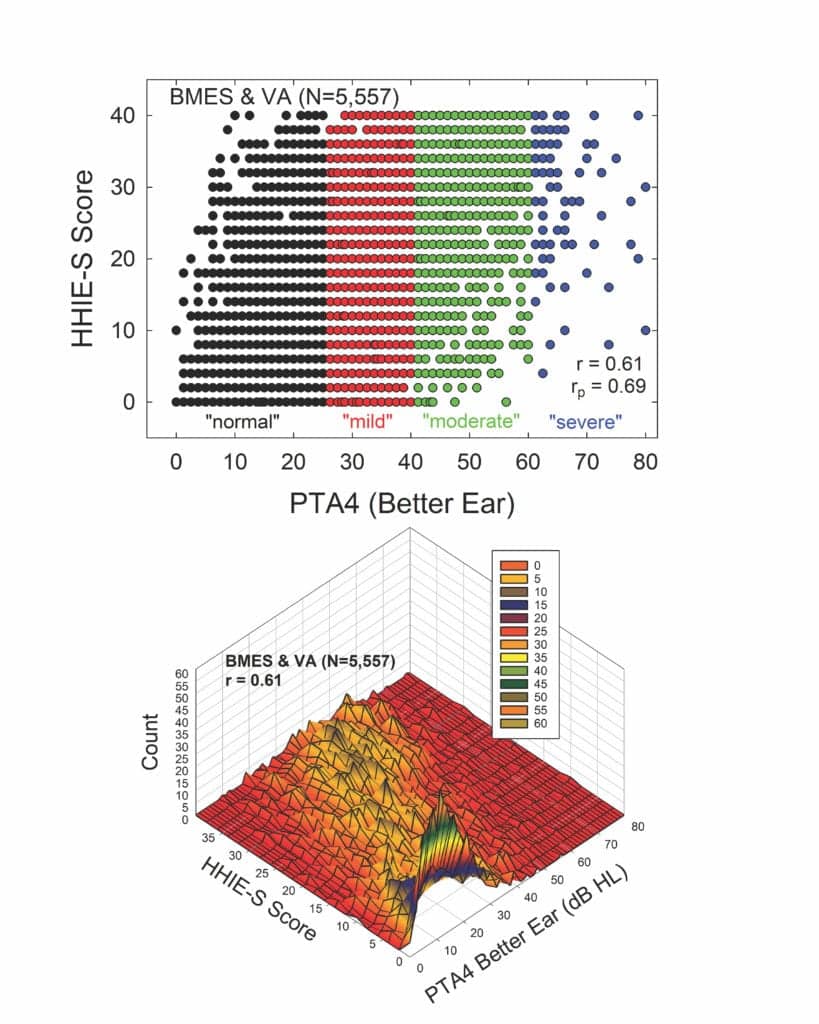
At first glance, these correlations may seem high given the variability shown in the scatterplot in the top panel. The scatterplot, however, does not convey multiple cases for the same combination of HHIE-S score and PTA4 value. The bottom panel of Figure 2 shows these same data, but now as a three-dimensional contour plot, with the peaks in this plot revealing the number of times each combination of HHIE-S score and PTA4 value was observed. The apparent visual “mountain range” that emerges in this plot shows a peak near the lowest HHIE-S and PTA4 combinations and the “mountain range” progresses diagonally upward such that there is a tendency for higher better-ear PTA4 values to yield higher HHIE-S scores.
As noted, the correlation, r, is 0.61. This means that knowledge of the better-ear PTA4 can explain about 36% (r2) of the individual variations in HHIE-S scores. Given that the test-retest correlation of the HHIE-S is about r=0.9,10,11,14 about 81% (r2) of the total variance is considered systematic variance due to differences among individuals and the balance, 19%, is attributed to random error in the measurements. Taken together, this means that the better-ear PTA4 can explain about 45% (36/81) of the systematic variance; the remaining 55% is not explained by PTA4.
The bottom line is that there is much more to quantifying the hearing problems of older adults than can be revealed by the pure-tone audiogram alone.
Hearing Impairment Grading in a Broader Context
Importantly, the WHO hearing-impairment grading systems not only quantify the severity of the hearing loss from the pure-tone audiogram as described above, they also maintained that “disabling” hearing impairment does not begin until the severity has reached the “moderate” level. As of March 1, 2020, this still appears to be the case (see https://www.who.int/news-room/fact-sheets/detail/deafness-and-hearing-loss). From the data presented in Figure 2, the perceived hearing difficulties of those with “normal” and “mild/slight” WHO hearing-impairment grades are often the same as those with “moderate” hearing-impairment grades, even though only the latter is considered to be a “disabling” impairment.
In the context of the broader and widely applied WHO-ICF model,15 the audiogram captures a key component of hearing-related “bodily impairment”.16 Just as important in the WHO-ICF model assessing an individual’s function, however, are the resulting limitations on activities and restrictions on participation experienced by the individual as a result of the bodily impairment, in this case hearing loss. Moreover, in the context of the WHO-ICF model, personal and environmental factors can further modulate the impact of hearing loss on subsequent social activities and participation in society. For example, the same audiogram for two hypothetical 70-year-old males may have different impacts on social activity depending on the individual’s cognitive function, socioeconomic status, and personality (personal factors), as well as environmental factors like whether he/she lives with others or alone and the type of setting (retirement community, nursing home, single-family dwelling, etc). As a result, despite identical audiograms and labeled hearing-impairment severity for our two hypothetical 70-year-old males, the perceived difficulties arising from impaired hearing may be quite different. Self-report measures can capture functional deficits in bodily impairment, activity limitations, and participation restrictions—the three key domains underlying function in the WHO-ICF model. Pure-tone audiometry captures only bodily impairment.
Observations During My Own Research
The following experience of the author illustrates another discrepancy between perceived hearing difficulties and classification of hearing impairment severity from the pure-tone audiogram. We recently conducted a randomized clinical trial (RCT) in which we advertised for older adults who had never worn hearing aids to serve as volunteers.17 The ad for this study stated clearly that the focus was on evaluating ways to fit hearing aids and that, at the conclusion of the study, participants would be asked to purchase hearing aids. Following an initial telephone screening to confirm age and lack of prior hearing aid experience, 361 older adults reported for an initial hearing evaluation.
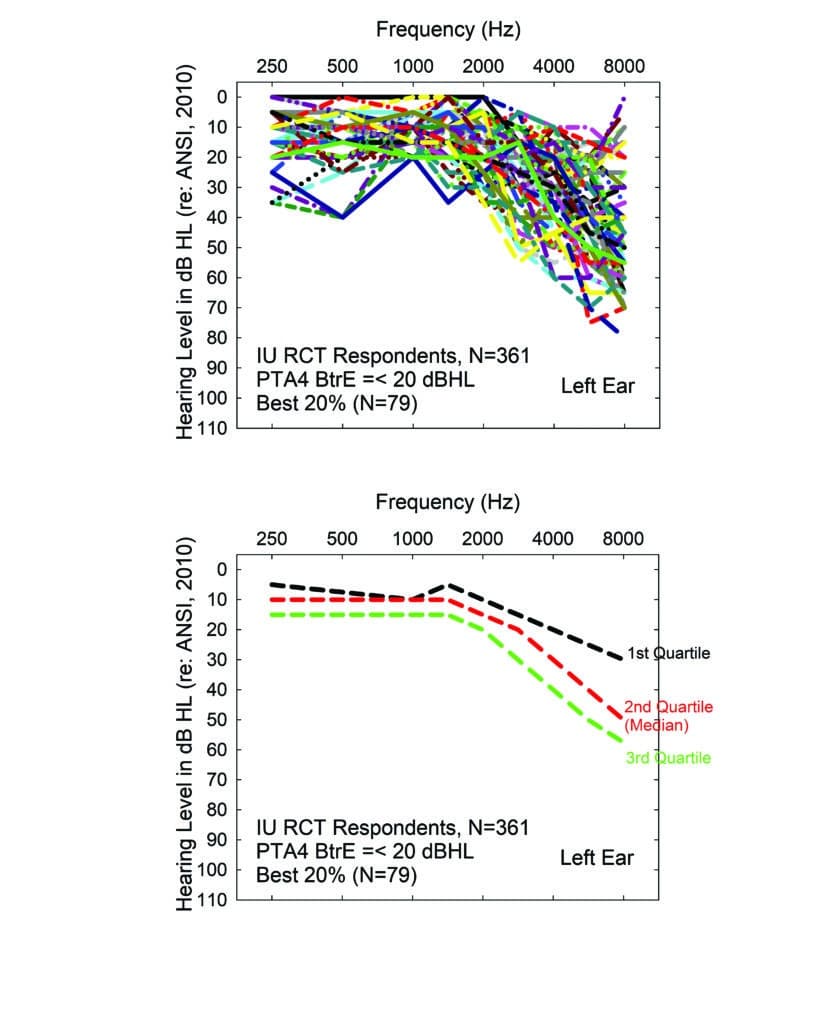
The top panel of Figure 3 shows the range of audiograms for the “best-hearing” 20% of that sample (79 individuals). Only the left-ear audiograms are shown here, but similar results were observed for the right ear. The bottom panel shows the medians and interquartile range for the 79 audiograms depicted in the top panel. Clearly, the best-hearing 20% of the 361 volunteers have measurable hearing loss in the high frequencies, typically mild to moderate in severity above 2000 Hz. Importantly, all these individuals would be classified by either WHO hearing-impairment grading system as “normal”. Recall that in this system, “disabling” hearing loss does not begin until “moderate” severity. There is debate about whether that should be modified to begin at “slight/mild” severity instead,18,19 but absolutely no discussion that it would apply to some with hearing labeled as “normal”. Yet, all of these individuals felt that they had enough hearing difficulty to make the effort to volunteer for a study evaluating hearing aids, including the strong possibility that they would be asked to purchase them at the end of the study. This again identifies the difficulty with relying too heavily on pure-tone audiometry for defining “disabling” hearing loss, as well as candidacy for hearing aids.
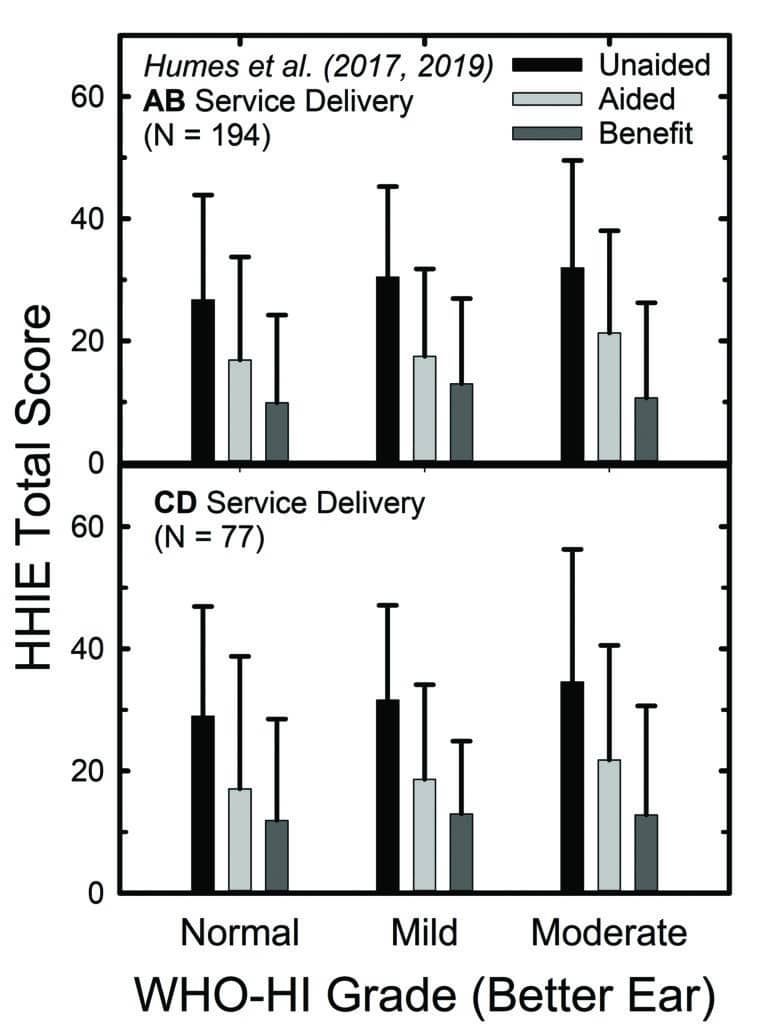
Of course, we didn’t rely solely on their decision to participate in the RCT as a baseline assessment of perceived hearing difficulties in that 2017 RCT, or in a subsequent follow-up RCT.20 We obtained several self-report measures at baseline and again following a 6-week period of hearing aid use. Figure 4 shows the means and standard deviations for the full 25-item HHIE (HHIE-Total). In the top panel, the outcomes were obtained after hearing aids were fit by an audiologist using best practices (AB), and the bottom panel shows data from the consumer-decides (CD) self-fit method studied in both RCTs.
Although the focus of those RCTs was on the comparison of outcomes between the fitting methods in the top and bottom panels of Figure 4, that is not the focus here. Rather, within each panel, the data have been separated into subgroups based on the whether their pure-tone audiogram was classified by the WHO6 grade system as “normal,” “mild,” or “moderate”. About 20% of the participants in each panel fell into each of the “normal” and “moderate” subgroups, with the remaining 60% falling into the “mild” subgroup. Notice first, regarding the unaided HHIE scores (black bars), that all three groups report unaided perceived hearing difficulties to be about the same, with mean HHIE-Total scores ranging from about 27 to 33. The light-grey bars in Figure 4 depict the aided HHIE-Total scores and the medium-grey bars show the HHIE benefit (unaided minus aided) scores. There were no significant differences (p>0.05) in mean HHIE benefit among the three groups in either panel of Figure 4.
So, not only did the “normal” group report unaided problems (black bars) similar in magnitude to those of the other two groups, they also demonstrated comparable reduction in their perceived hearing difficulties while wearing hearing aids (medium-gray bars). Perhaps as importantly, at study completion, nearly 80% of those in the “normal” group purchased their hearing aids at the end of the RCT. Clearly, these older adults perceived that they had hearing difficulties initially and felt that the hearing aids had reduced their difficulties substantially—enough to purchase their devices.
Other Indicators for Hearing Aid and Amplification Benefit
Others have recently demonstrated measurable benefits for hearing aids provided to those who would meet the WHO-based definition of “normal” hearing but have self-reported hearing difficulties.21 If the requirement for candidacy for assistance is “disabling” hearing impairment, then none of these “normal”-hearing individuals would have been identified as candidates, nor would those in the “mild” hearing loss group for that matter.
To recap, reliance on pure-tone audiometry for the classification of hearing impairment in older adults will likely under-identify people who are having difficulties and the number who could benefit from assistance, including hearing aids. There are other forms of assistance aside from hearing aids that may be relevant as well, including assistive listening devices,22 smartphone hearables, and auditory/cognitive training,23-25 among others. With regard to hearing aids for older adults with “mild-to-moderate hearing loss,” the recently enacted Over The Counter Hearing Aid Act of 2017, signed into US Federal Law in 2018, relies on “…perceived mild to moderate hearing impairment…” for device candidacy in adults. The Act also states that guidelines for OTC hearing aids “…may…include tests for self-assessment of hearing loss…” Reliable and valid self-assessment tools, such as the HHIE, might be viable options for objective self-identification of candidacy, as well as for documentation of the benefits provided (see Figure 4).
Among other self-assessment tools that have been developed, the triple-digits-in-noise tests probably have been most widely used and evaluated.26-29 For the US version of the test, the correlation between the speech-in-noise threshold with triple digits and the four-frequency pure-tone average (PTA4) is r=0.65.29 This correlation is similar to that noted above between the HHIE and PTA4. Thus, both the HHIE and triple-digits-in-noise tests may be similarly related to the “bodily impairment” component of the WHO-ICF, but it is likely that self-report measures, like the HHIE, would better capture the other components contributing to function: activity limitations and participation restrictions. This remains to be evaluated.
Of course, there is no need to limit self-report measures, such as the HHIE, to those choosing to self-fit their devices. Such broad self-report measures that assess aspects of activity limitations and participation restrictions experienced by the individual as a result of hearing loss should also be routinely incorporated into audiological practice prior to and following the fitting of hearing aids. Few clinicians would consider gain provision, even if verified by contemporary real-ear measures or behavioral functional gain measures, to be a valid indicator of benefit. Rather, it is the consequences of that gain provision on everyday communication and social function, as well as on the emotional reactions to any limitations or restrictions experienced, that are of primary concern.
Understanding Access and the Hurdles to Obtaining Hearing Help
Further, as noted, the focus does not need to be placed entirely on intervention with a device, as not all those believed to be candidates for help with hearing aids will pursue them, even if the devices are made more affordable. This is supported by a study by Pronk et al30 in the Netherlands. For the participants in this study, about 75% of the cost of hearing aids was covered by health insurance, enhancing the affordability of the devices. This study focused on adults 55 years of age and older with at least mild high-frequency hearing loss (≥35 dB HL average at 1000, 2000 and 4000 Hz) who had no prior experience with hearing aids. After an initial evaluation to determine study eligibility and candidacy for hearing aids, 1,437 hearing aid candidates were invited by mail to participate in the Dutch standard 2-month hearing aid trial period. Of these 1,437 people contacted by mail, 377 (26%) agreed to participate, returned the completed materials mailed previously, and were included in subsequent analyses.
Four months later, records were examined to determine who, in fact, had begun the 2-month hearing aid trial period. Most (66%) did so, but the remaining 34% did not follow up to enroll in the trial period. It is hard to interpret the “no reply” candidates, however, who constituted 74% of the original 1,437 hearing-aid candidates contacted by mail. Nonetheless, ignoring the “no reply” cases, about one-third of those who did reply failed to pursue the hearing-aid trial period despite the low cost. Interestingly, self-reported hearing difficulties—such as those captured by surveys like the HHIE—were a strong predictor of participation in the hearing aid trial period, especially when the participant was ready for change (as documented by another questionnaire).
Pronk et al’s findings30 generally agree with an earlier study by Laplante-Levesque et al31 in which 153 participants who met hearing aid candidacy criteria were invited to pursue either hearing aids or a communication-enhancement training program23 immediately following determination of candidacy. When records were reviewed 6 months later, 43% had returned for hearing aids, 18% had completed the communication program, and 39% had not completed either intervention. For most (62-73%) of the 153 participants, subsidies covered the costs of the hearing aids and this was a key predictor of hearing aid uptake, along with the socioeconomic status of the older adult. This reinforces the importance of affordability. Nonetheless, even when efficacious alternatives to hearing aids are offered, the percentage who declined all intervention (39%) is not appreciably different from those who were offered only a hearing aid trial period (34%) in the study by Pronk et al.30 The Laplante-Levesque et al study31 also examined a wide array of potential predictors for intervention uptake, and self-reported hearing difficulties were again found to be a significant predictor.
The studies by Laplante-Levesque et al31 and Pronk et al30 illustrate that, even when device affordability has been addressed, accessibility may still be a factor limiting uptake of intervention, whether the devices are hearing aids or alternatives such as communication training. Here, accessibility can mean simply the requirement to make and keep appointments with professionals at several steps along the conventional clinical pathway to intervention.
Figure 5 makes use of the data from Yueh et al32 for older adults served within the Veterans Administration—where costs of the devices and services were covered entirely—to illustrate the attrition experienced at each successive step along a typical clinical pathway. The far-left vertical bar indicates that almost 50% of the 1,382 older adults in this study failed one of the hearing screening methods examined. Once they identified those who had failed the screening, recommendations to follow-up with an audiologist were made to the participant orally and in writing. The investigators then tracked clinical records over the ensuing year for each of these older adults to determine the clinical events in which each had participated. Each subsequent vertical bar in Figure 5 shows the percentage who met each of the clinical follow-up milestones during the 12 months following failure of the screening.
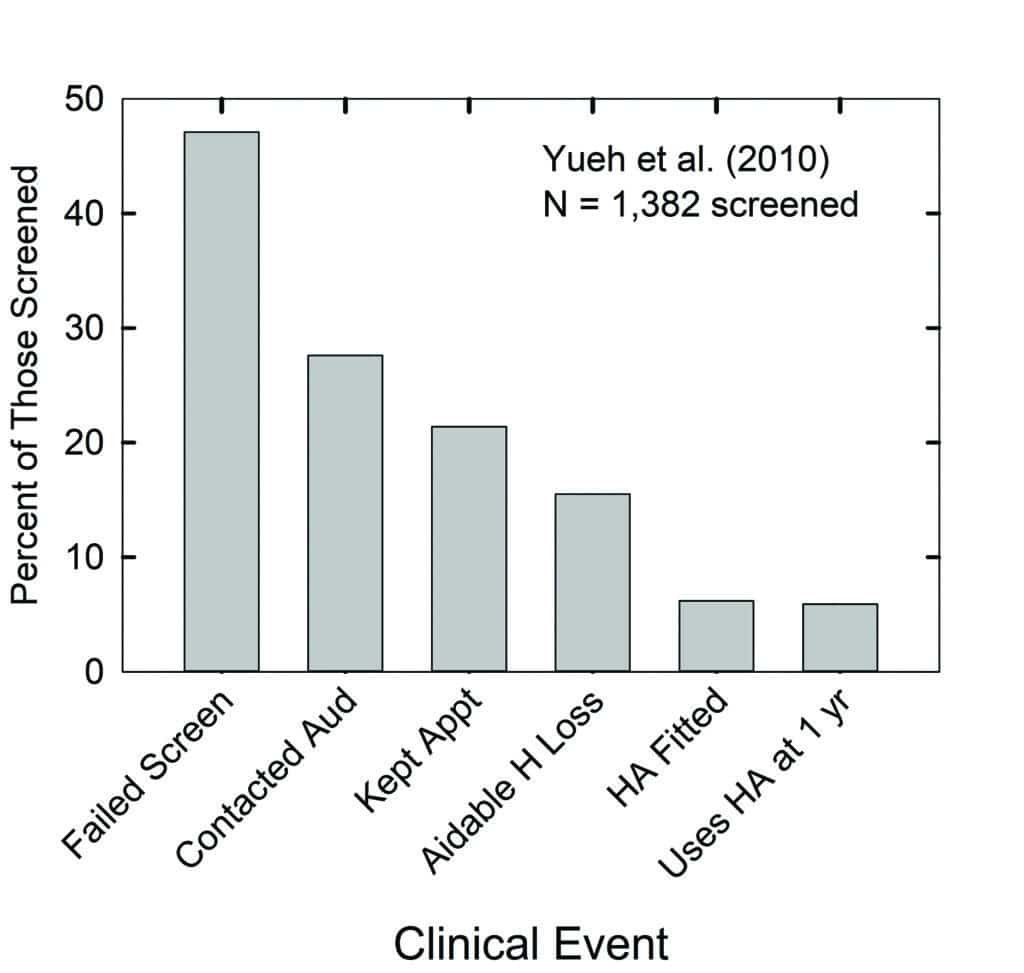
These data indicate that less than 30% of the entire sample—or about 60% of those who failed the hearing test—contacted the audiologist to make an appointment for an evaluation. A little over 20% kept that appointment with the audiologist, about 17% were designated by the audiologist as having aidable hearing loss (presumably relying heavily on the pure-tone audiogram), and less than half of these returned to have hearing aids fitted. Finally, about 6% reported using their hearing aids a year later.
The pooled data from this study exhibit the progressive loss of older adults from the conventional hearing healthcare system over time. Further, although there were no direct costs charged to the participants in this study at each clinical event, this is not common practice in the US. Thus, it is not only the number of hurdles limiting the access to hearing aids illustrated in Figure 5, but several of the appointments along the way would commonly incur their own incremental charges and decrease the affordability of hearing aids as well.
Reduced accessibility to intervention may well have contributed to the limited uptake of intervention in the studies by Laplante-Levesque et al31 and Pronk et al.30 For many older adults, journeying to and from the hearing professional’s office to pursue diagnosis and intervention may represent a significant barrier to the uptake of hearing assistance. It is likely a part of the older adult’s “cost-benefit analysis” when deciding to seek help, where these costs are in effort and inconvenience.
It is also likely that those who sought help from hearing healthcare professionals during their journey for help, including those with pure-tone audiometry reflecting “normal,” “slight,” or “mild” severity grade, have been counseled that such hearing loss is “normal for their age” and that not much can be done about it. For example, according to the 2019 MarkeTrak 10 report,33 of the nearly 2,000 respondents with self-reported hearing difficulties who were not hearing-aid owners, 79% were told by their primary-care physician that they had some hearing loss but that it was “not bad enough” to address at the time. The situation was only slightly better for ENT physicians with 58% advising patients with hearing loss that it was “not bad enough.” Of those non-owners seen by a hearing care provider, typically an audiologist, 46% were told to hold off on hearing aids and 90% of this group of patients had self-reported hearing loss that was either “mild” or “moderate.”
A Start: Giving Consumers the Correct Information About Their Hearing Loss
So, not only does the older adult have to clear several hurdles restricting access to hearing aids through the prevailing hearing healthcare system, but their encounters with various healthcare professionals along the way may serve to demotivate the older adult with perceived hearing difficulties during their pursuit of help.
Repeatedly, as in the studies by Laplante-Levesque et al31 and Pronk et al,30 reviews and large-scale studies have identified self-reported hearing difficulties as one of the strongest predictors of hearing aid uptake and use.34-36 This further reinforces the need for the older consumer and the hearing care professional to quantify the severity of their hearing difficulties above and beyond those captured by the pure-tone audiogram.
Valid and reliable self-report measures of hearing difficulties and their consequences are key in that regard. Failure to make use of self-report tools may inaccurately estimate the extent of difficulties experienced, the likelihood of seeking intervention, and the success of that intervention. Moreover, self-administered online surveys (eg, HHIE) could quantify the perceived difficulties, both prior to and following intervention, to allow a more formal assessment of benefit.
With access to hearing aids and alternative interventions likely to increase in the very near future due to the OTC Hearing Aid Act, a new era of hearing healthcare for older adults will soon begin. The older consumer with perceived hearing difficulties will be empowered to address those needs directly and will be able to do so affordably.
This is an exciting new era of hearing healthcare. There is mounting evidence that those with even slight elevations in high-frequency hearing thresholds and accompanying perceived hearing difficulties can benefit from assistance, whether that is with devices such as hearing aids or hearables, with web-based interventions, or with delivery of services more conveniently through telehealth.
Ultimately, the goal is not to take opportunities away from any specific hearing healthcare professional within the existing model of service provision. This model has served the needs of many individuals quite well and will continue to do so. The focus in the upcoming decade will be to expand the market and the alternatives available to adults with “normal,” “slight,” or “mild” hearing loss and the consequent perceived hearing difficulties. These individuals, many of whom are older adults, represent the 75-85% whose hearing needs have not been met by the prevailing hearing healthcare system.37
Acknowlegement
The author was paid by GN Hearing as a consultant for the time spent working on this article.
References
1. Kryter KD. Evaluation of hearing handicap. J Am Acad Audiol. 1998;9:141-146.
2. Kryter KD. Impairment to hearing from exposure to noise. J Acoust Soc Am.1973; 53:1211.
3. Kryter KD. Evaluation of hearing handicap. J Amer Acad Audiol. 1998;9:141-146.
4. Clark JG. Uses and abuses of hearing loss classification. ASHA. 1981;23(7):493-500.
5. International Standards Organization (ISO). ISO 7029:2017—Acoustics—Statistical distribution of hearing thresholds related to age and gender. https://www.iso.org/standard/42916.html. Published January, 2017.
6. World Health Organization (WHO). Report of the informal working group on prevention of deafness and hearing impairment programme planning. https://apps.who.int/iris/handle/10665/58839. Published June, 1991.
7. Stevens G, Flaxman S, Brunskill E, Mascarenhas M, Mathers CD, Finucane M. Global and regional hearing impairment prevalence: An analysis of 42 studies in 29 countries. Eur J Public Health. 2013;23(1):146-52.
8. Humes LE. The World Health Organization’s hearing-impairment grading system: An evaluation for unaided communication in age-related hearing loss. Int Jour Audiol. 2019;58(1).
9. Humes LE. Examining the validity of the World Health Organization’s long-standing hearing impairment grading system for unaided communication in age-related hearing loss. Am J Audiol. 2019;28(3S):810-818.
10. Ventry IM, Weinstein BE. The hearing handicap inventory for the elderly: A new tool. Ear Hear. 1982;3(3):128-134.
11. Ventry IM, Weinstein BE. Identification of elderly people with hearing problems. ASHA. 1983;25(7):37-42.
12. Sindhusake D, Mitchell P, Smith W, et al. Validation of self-reported hearing loss. The Blue Mountains hearing study. Int J Epidemiol. 2001;30(6):1371-1378.
13. Wilson RH. Clinical experience with the words-in-noise test on 3430 veterans: Comparisons with pure-tone thresholds and word recognition in quiet. J Am Acad Audiol. 2011;22(7):405-423.
14. Tomioka K, Ikeda H, Hanaie K, et al. The Hearing Handicap Inventory for Elderly-Screening (HHIE-S) versus a single question: Reliability, validity, and relations with quality of life measures in the elderly community, Japan. Quality of Life Research. 2013;22: 1151-1159.
15. World Health Organization (WHO). International classification of functioning, disability, and health. https://apps.who.int/iris/bitstream/handle/10665/42407/9241545429.pdf. Published 2001.
16. Meyer C, Grenness C, Scarinci N, Hickson L. What is the international classification of functioning, disability and health and why is it relevant to audiology? Seminars in Hearing. 2016; 37(3):163-186.
17. Humes LE, Rogers SE, Quigley TM, Main AK, Kinney DL, Herring C. The effects of service-delivery model and purchase price on hearing-aid outcomes in older adults: A randomized double-blind placebo-controlled clinical trial. Am J Audiol. 2017;26(1):53-79.
18. Timmer BHB, Hickson L, Launer S. Adults with mild hearing impairment: Are we meeting the challenge? Int J Audiol. 2015;54(11):786-95.
19. Ferguson MA, Kitterick PT, Chong LY, Edmondson-Jones M, Barker F, Hoare DJ. Hearing aids for mild to moderate hearing loss in adults. Cochrane Database of Systematic Reviews. 2017;(9):Art.No.CD012023.
20. Humes LE, Kinney DL, Main AK, Rogers SE. A follow-up clinical trial evaluating the consumer-decides service delivery model. Am J Audiol. 2019;28(1):69-84.
21. Roup CM, Post E, Lewis J. Mild-gain hearing aids as a treatment for adults with self-reported hearing difficulties. J Am Acad Audiol. 2018;29:477-494.
22. Harkins J, Tucker P. An internet survey of individuals with hearing loss regarding assistive listening devices. Trends Amplif. 2007;11(2):91-100.
23. Hickson L, Worrall L, Scarinci N. A randomized controlled trial evaluating the active communication education program for older people with hearing impairment. Ear Hear. 2007;28(2):212-230.
24. Ferguson MA, Henshaw H. Auditory training can improve working memory, attention, and communication in adverse conditions for adults with hearing loss. Frontiers Psychol. 2015;6:556.
25. Lawrence BJ, Jayakody DMP, Henshaw H, et al. Auditory and cognitive training for cognition in adults with hearing loss: A systematic review and meta-analysis. Trends Hear. 2018;22:1-20.
26. Smits C, Kapteyn TS, Houtgast T. Development and validation of an automatic speech-in-noise screening test by telephone. Int J Audiol. 2004;43(1):15-28.
27. Smits C, Houtgast T. Results from the Dutch speech-in-noise screening test by telephone. Ear Hear. 2005;26(1):89-95.
28. Watson CS, Kidd GR, Miller JD, Smits C, Humes LE. Telephone screening tests for functionally impaired hearing: Current use in seven countries and development of a US version. J Am Acad Audiol. 2012;23(10):757-767.
29. Williams-Sanchez V, McArdle RA, Wilson RH, Kidd GR, Watson CS, Bourne AL. Validation of a screening test of auditory function using the telephone. J Am Acad Audiol. 2014;25(10):937-951.
30. Pronk M, Deeg DJH, Versfeld NJ, Heymans MWH, Naylor G, Kramer SE. Predictors of entering a hearing aid evaluation period: A prospective study in older hearing-help seekers. Trends Hear. 2017;21:1-20.
31. Laplante-Lévesque A, Hickson L, Worrall L. What makes adults with hearing impairment take up hearing aids or communication programs and achieve successful outcomes? Ear Hear. 2012;33(1):79-93.
32. Yueh B, Collins MP, Souza PE, et al. Long‐term effectiveness of screening for hearing loss: The Screening for Auditory Impairment—Which Hearing Assessment Test (SAI-WHAT) randomized trial. J Am Geriatrics Soc. 2010;58(3):427-34.
33. Powers TA, Rogin CM. MarkeTrak 10: Hearing aids in an era of disruption and DTC/OTC devices. Hearing Review. 2019;26(8):12-20.
34. Knudsen LV, Öberg M, Nielsen C, Naylor G, Kramer SE. Factors influencing help seeking, hearing aid uptake, hearing aid use and satisfaction with hearing aids: A review of the literature. Trends Amplif. 2010;14(3):127-154.
35. Hickson L, Meyer C, Lovelock K, Lampert M, Khan A. Factors associated with success with hearing aids in older adults. Int J Audiol. 2014;53(Suppl 1):S18-S27.
36. Barker AB, Leighton P, Ferguson MA. Coping together with hearing loss: A qualitative meta-synthesis of the psychosocial experiences of people with hearing loss and their communication partners. Int J Audiol. 2017;56(5)[May 4]:297-305.
37. Humes LE. Some considerations for audiologists as the hearing aid era dawns in the US. Canadian Audiologist. 2020;7(2).
Correspondence to Dr Humes at: [email protected].
Original citation for this article: Humes LE. What is “normal hearing” for older adults and can “normal-hearing older adults” benefit from hearing care intervention? Hearing Review. 2020;27(7).12-18.